# Load the package:
library(MVN)Diagnostic Visualizations
Before relying on numerical test results, it’s essential to visualize data to identify patterns and deviations. We’ll demonstrate a suite of diagnostic plots implemented in MVN.
Example Data
We’ll use two numeric variables from the built-in iris dataset:
df <- iris[1:50, 1:2]
head(df)
Sepal.Length Sepal.Width
1 5.1 3.5
2 4.9 3.0
3 4.7 3.2
4 4.6 3.1
5 5.0 3.6
6 5.4 3.9We’ll run the Henze–Zirkler test
result <- mvn(data = df)Multivariate Diagnostics
1. Mahalanobis Q–Q Plot
Compare empirical Mahalanobis distances to theoretical chi-square quantiles:
plot(result, diagnostic = "multivariate", type = "qq")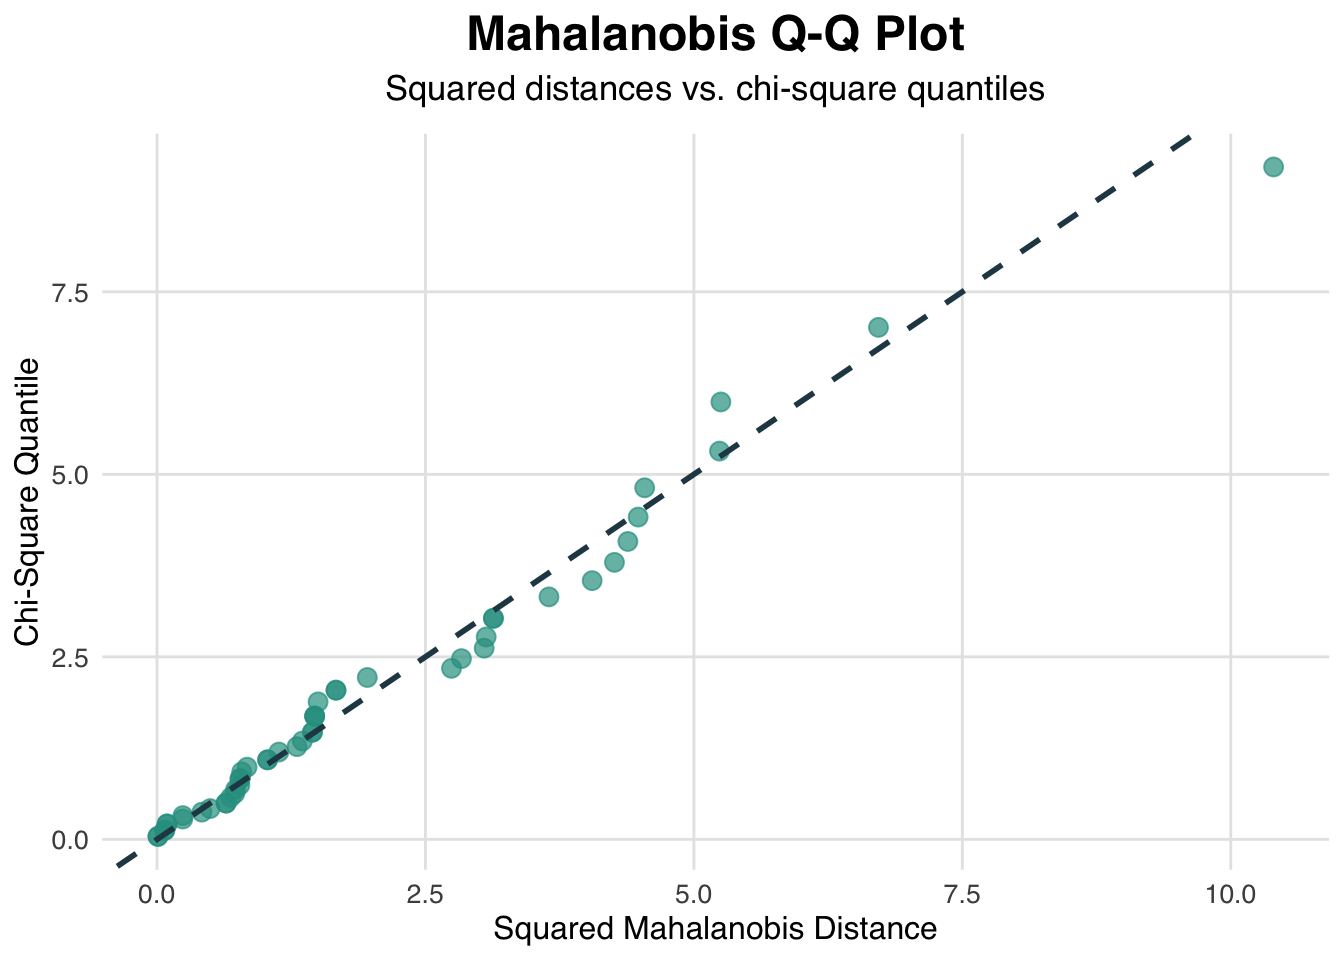
Points deviating from the line signal departures from multivariate normality.
2. 3D Perspective Plot
Visualize the estimated multivariate density surface:
plot(result, diagnostic = "multivariate", type = "persp")Rotate and inspect peaks and valleys to detect shape irregularities.
3. Contour Plot
Overlay density contours on the variable space:
plot(result, diagnostic = "multivariate", type = "contour")Contour levels highlight regions of equal density; distorted shapes indicate non-normality.
Univariate Diagnostics
1. Q–Q Plots
Assess each variable against a theoretical normal distribution:
plot(result, diagnostic = "univariate", type = "qq")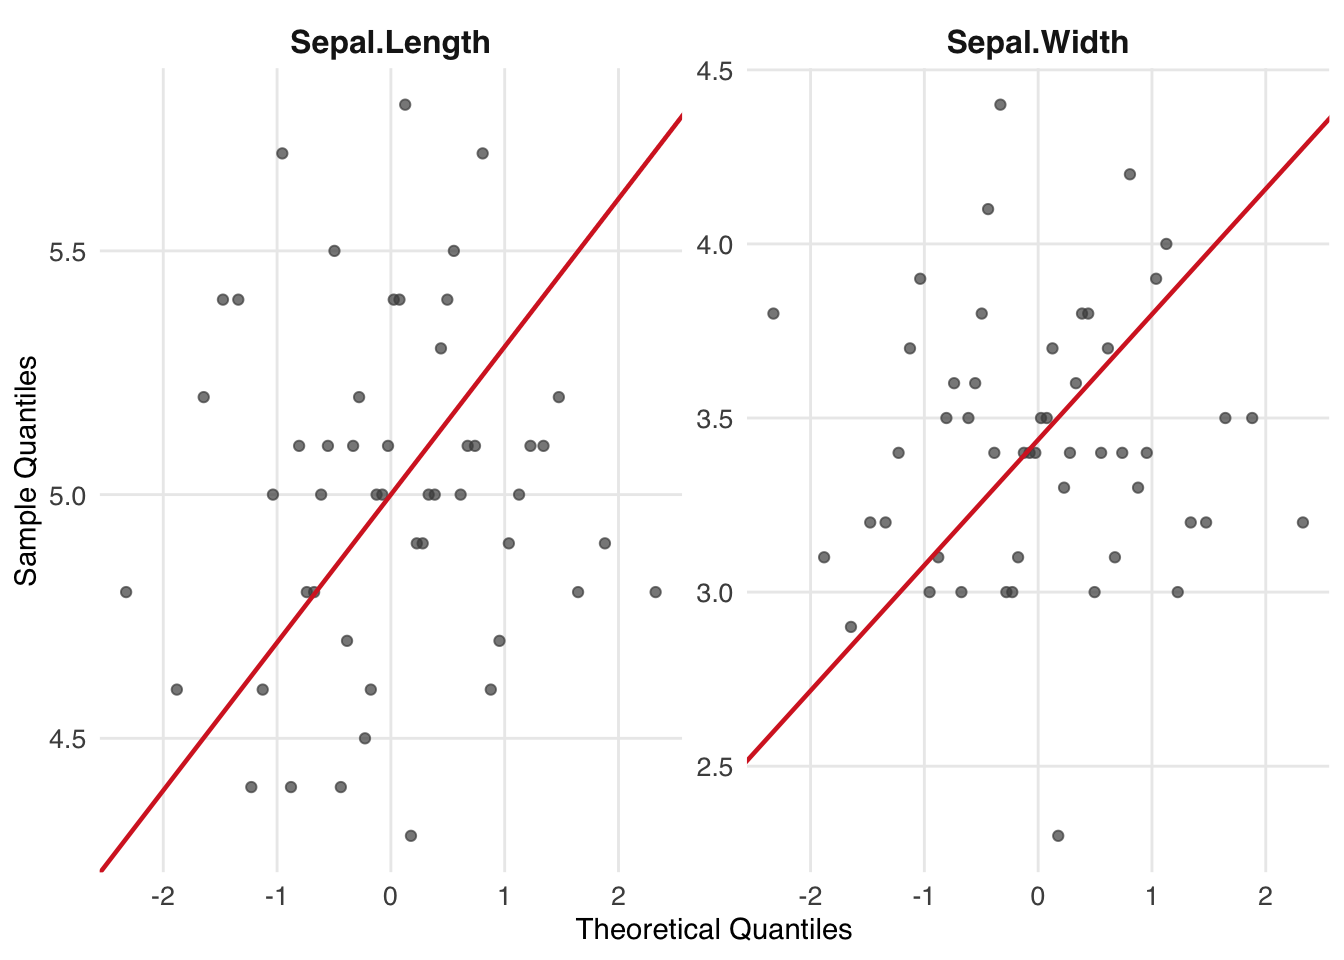
Good normality shows points near the line across variables.
2. Boxplots
Visualize median, quartiles, and potential outliers for each variable:
plot(result, diagnostic = "univariate", type = "boxplot")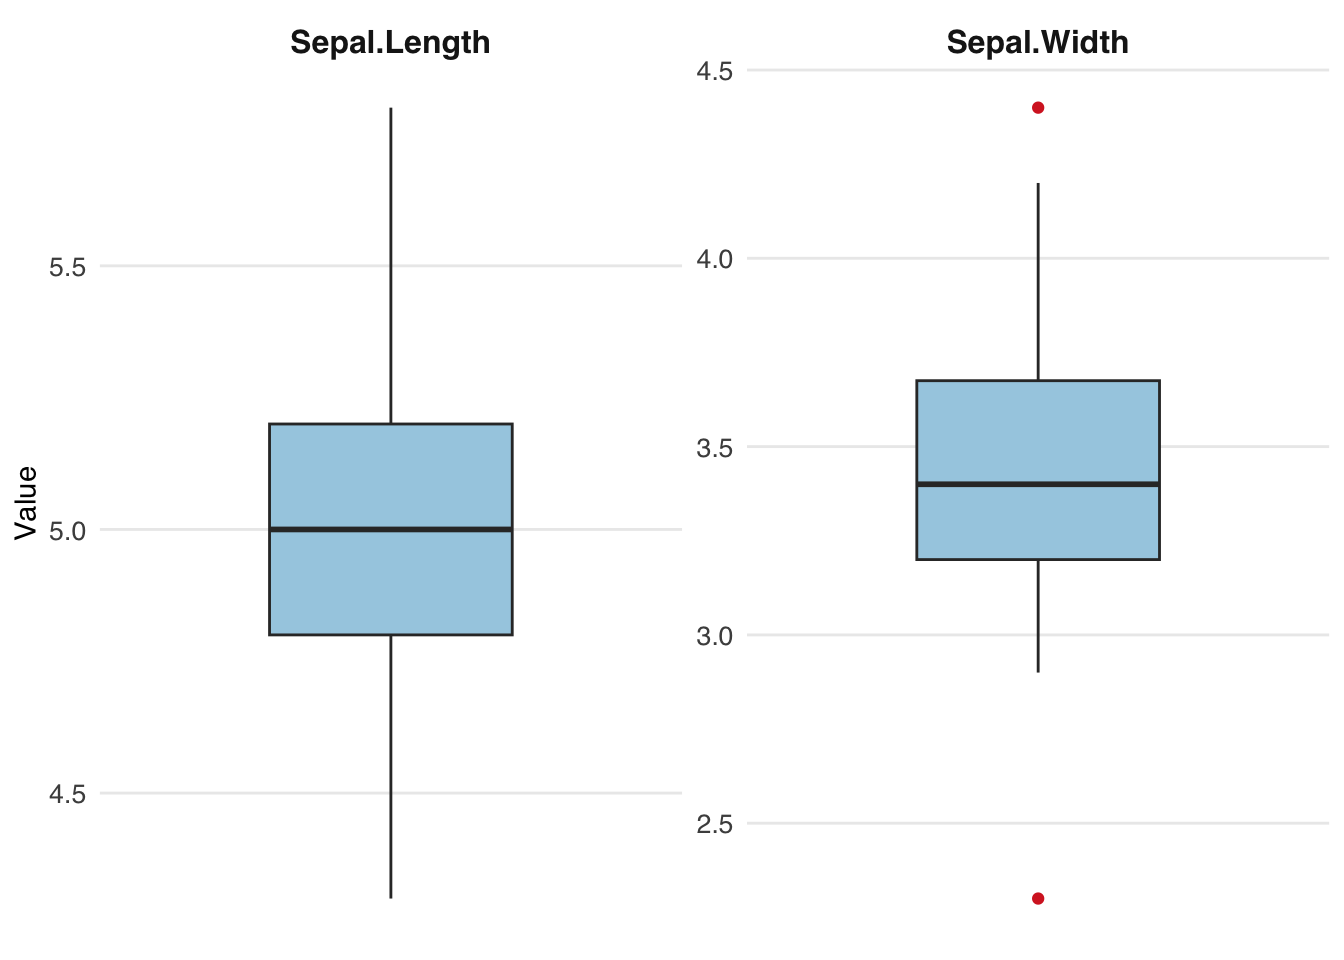
Outliers appear as points beyond whiskers; asymmetry suggests skew.
3. Histograms
Combine histograms with fitted normal density curves:
plot(result, diagnostic = "univariate", type = "histogram")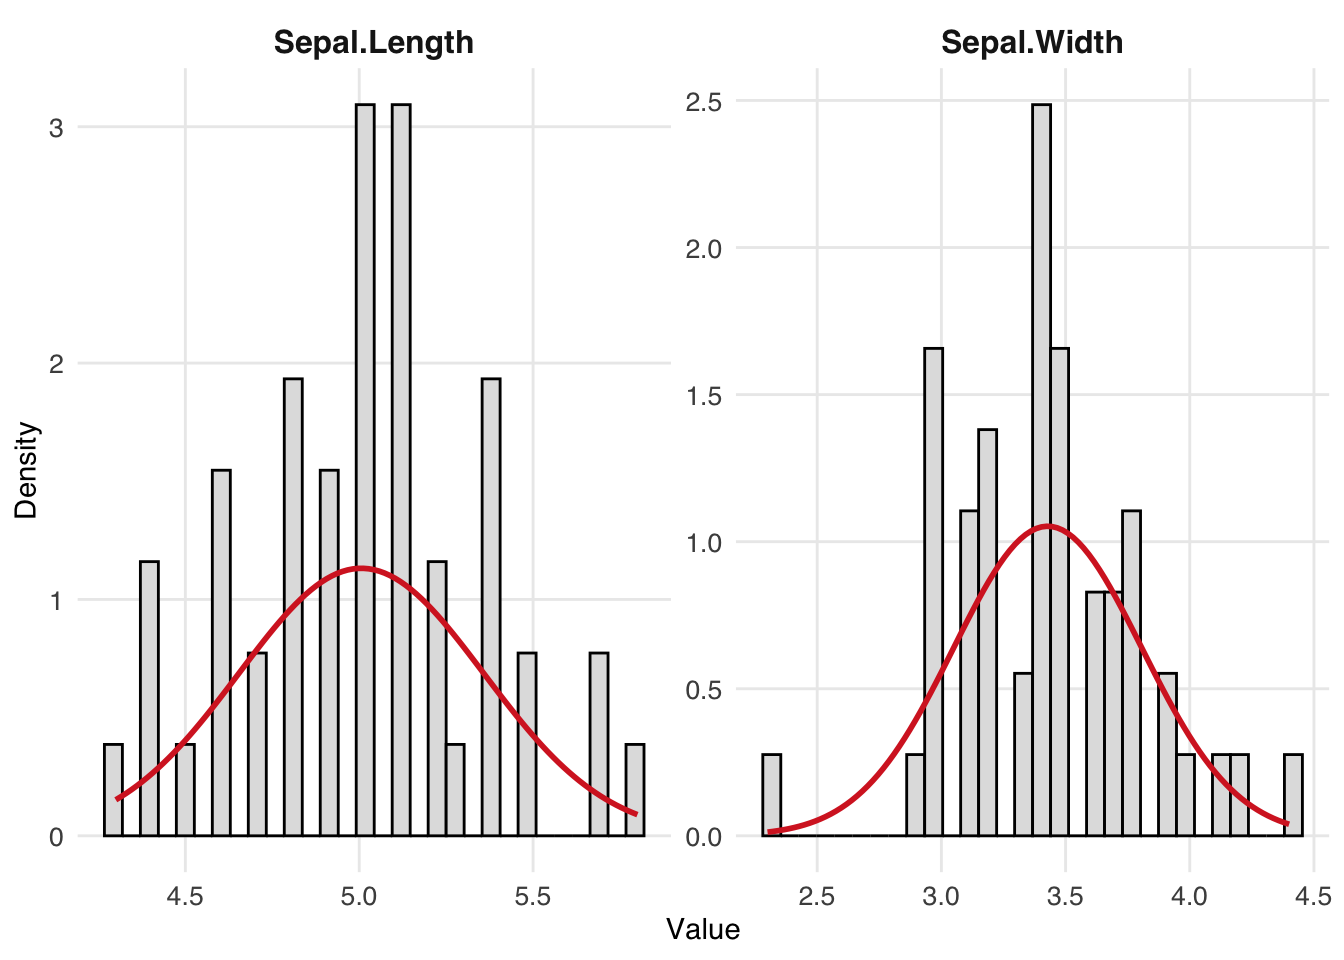
Compare empirical distributions to the smooth normal curve.
4. Scatterplot Matrix
Explore pairwise relationships among variables:
plot(result, diagnostic = "univariate", type = "scatter")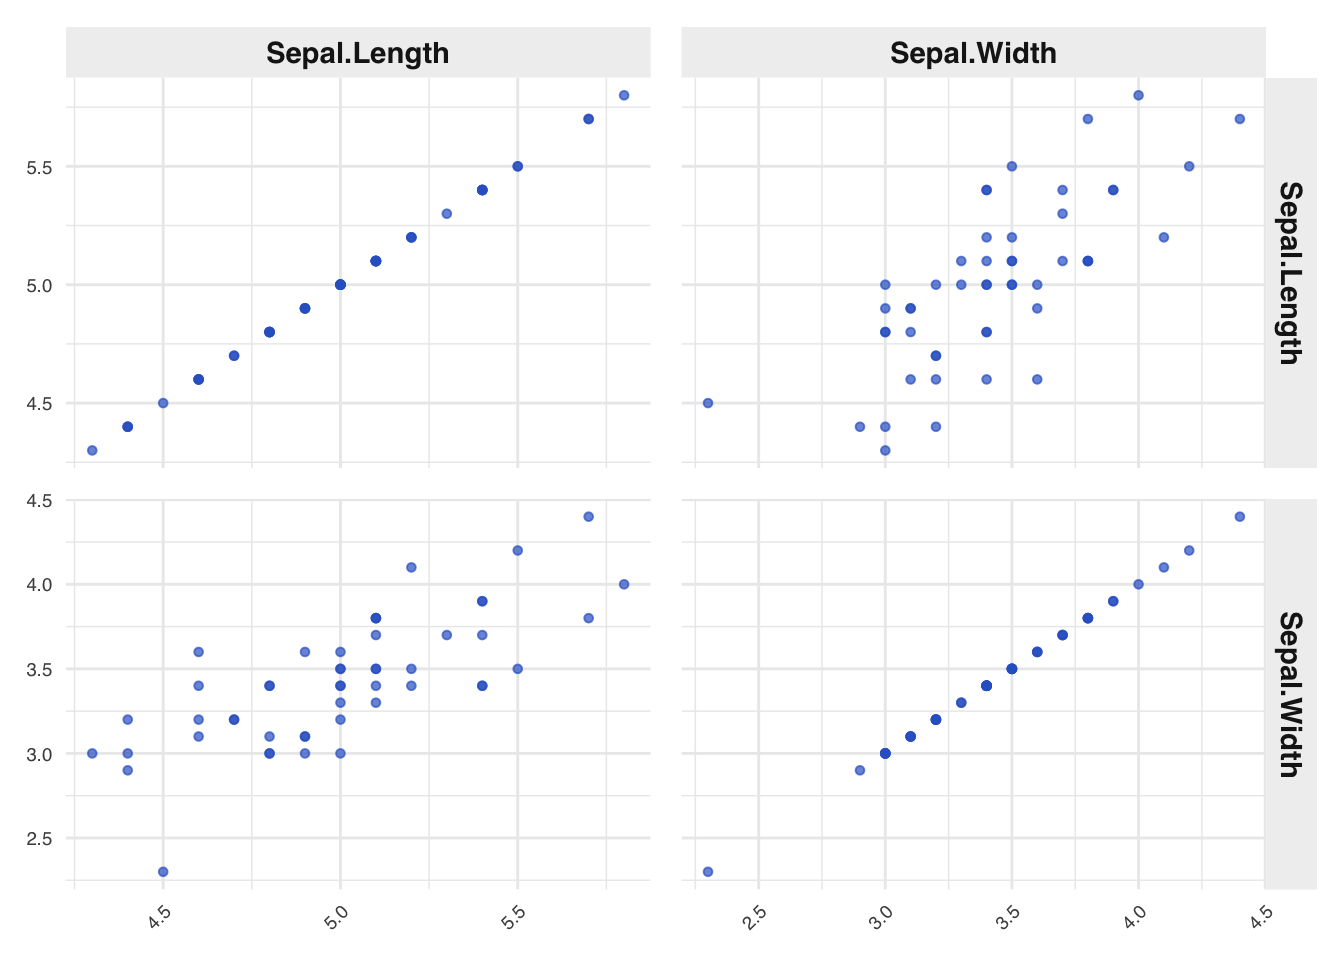
Tip
For interactive exploration, set interactive = TRUE in any plot call to use Plotly-based versions with zoom and hover capabilities.
References
Korkmaz S, Goksuluk D, Zararsiz G. MVN: An R Package for Assessing Multivariate Normality. The R Journal. 2014;6(2):151–162. URL: https://journal.r-project.org/archive/2014-2/korkmaz-goksuluk-zararsiz.pdf